Installing Xdebug on WSL Ubuntu to debug WordPress plugins
I use VS Code and WSL as my integrated development environment. From testing my new import speeds (1 million products in 100 minutes!) I ended up with a huge WSL install.
I thought the max size was 256GB, but it turns out it works after that, it just gets VERY slow. So I had to reinstall WSL Ubuntu so now is a perfect chance for me to write a guide on installing Xdebug so you can debug your code on local. Obviously you must have WSL installed on your local first, as well as VS Code.
Table of Contents
Install Xdebug on your local WSL
This part is pretty easy. Run:
sudo apt-get install php8.3-xdebugNow that this is installed, navigate to the php conf.d folder:
cd /etc/php/8.3/fpm/conf.dIf you list the files in that folder, you will see a new 20-xdebug.ini there which is configuring the extension. We now need to configure a couple of extra options, so make a new file called 99-xdebug.ini
sudo vi /etc/php/8.3/fpm/conf.d/99-xdebug.ini
(or use another editor if you don’t like vim) Then inside the file, add the following:
xdebug.mode = debug
xdebug.start_with_request = yes
Save your file, and restart PHP:
sudo service php8.3-fpm restartStart the debugger from inside VS Code
Now, navigate to your wordpress folder and start up VS Code from that folder. Typically, I use:
cd /var/www/superspeedy/htdocs
code .
The “code .” command will start VS Code in this ‘workspace’ and let you have access to all of your WordPress files. This is required in case any breakpoints or errors happen in WordPress core.
Now click the play button on the left to switch to the RUN AND DEBUG screen then click the play button along the top. This may be positioned further to the right for you.
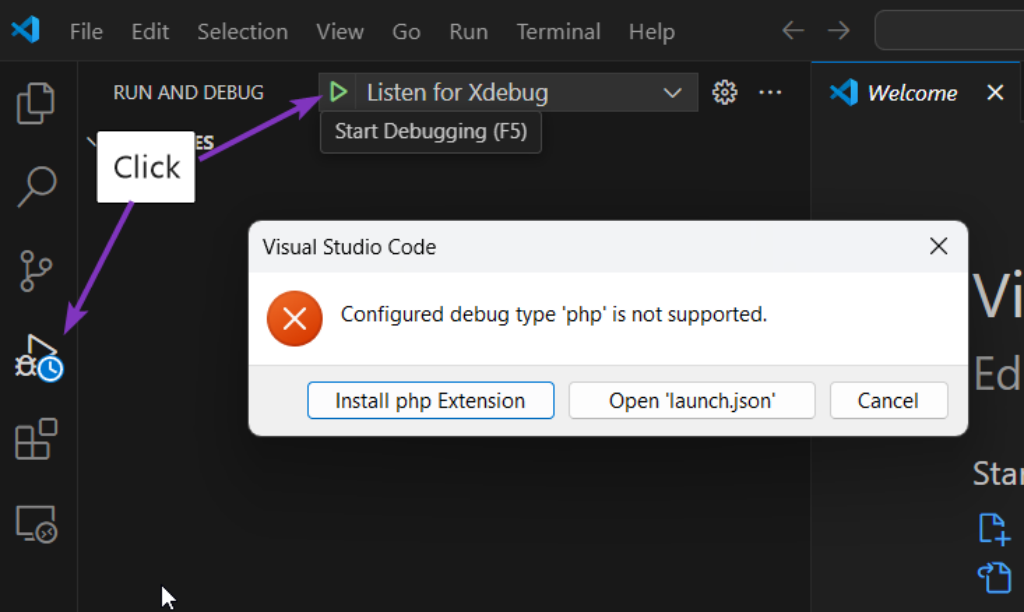
Depending on what extensions you have installed on your Windows version of VS Code, the list of extensions you see may vary.
In my case, I already have PHP Debug installed in VS Code, however – there are two installation destinations for extensions with VS Code – in the client and in the server. In this case, the client is running on Windows and the server is the WSL instance. When the extensions are installed there, it makes it possible for VS Code to communicate with Xdebug.
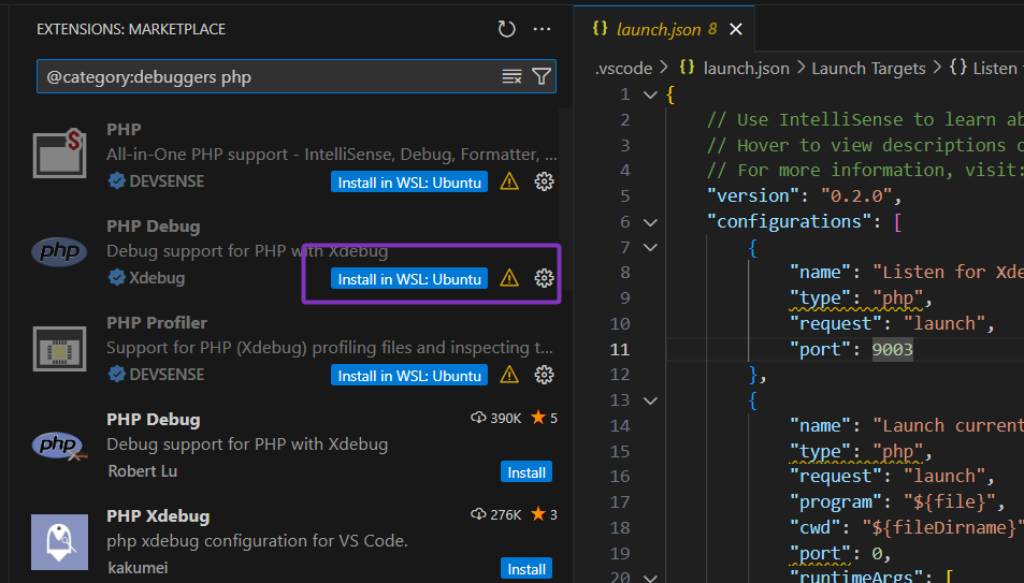
So in my case, I can click Install in WSL: Ubuntu, but if you have never installed PHP Debug just search for that at the top and ensure it’s the one made by Xdebug. Ensure you install the PHP Debug extension on your computer AND in WSL: Ubuntu – it should do this automatically for you.
Now try clicking play again and if you don’t get any errors you should be good to go.
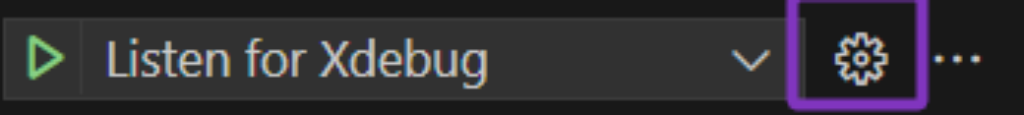
If you still have issues, you might need to edit your launch.json file. To access that, click the cogwheel next to the Listen for Xdebug bar.
Your launch.json needs a “Listen for Xdebug” section with request: launch and a port number. For example, here’s the most basic launch.json you need.
{
    "version": "0.2.0",
    "configurations": [
        {
            "name": "Listen for Xdebug",
            "type": "php",
            "request": "launch",
            "port": 9003
        }
    ]
}
When you initially create your launch.json, VS Code will create it for you, but it probably will only add two other useless entries. You can replace that entirely with the above. The port number should be correct at 9003. Some installs in the past used 9000 but that seems to have changed.
Test your Xdebug Installation in VS Code
In VS Code, open a file which will be loaded on every page, say wp-settings.php or wp-config.php and if you hover your mouse over the area to the left of the line numbers, you should see a faint red colour and a tooltip explaining breakpoints.
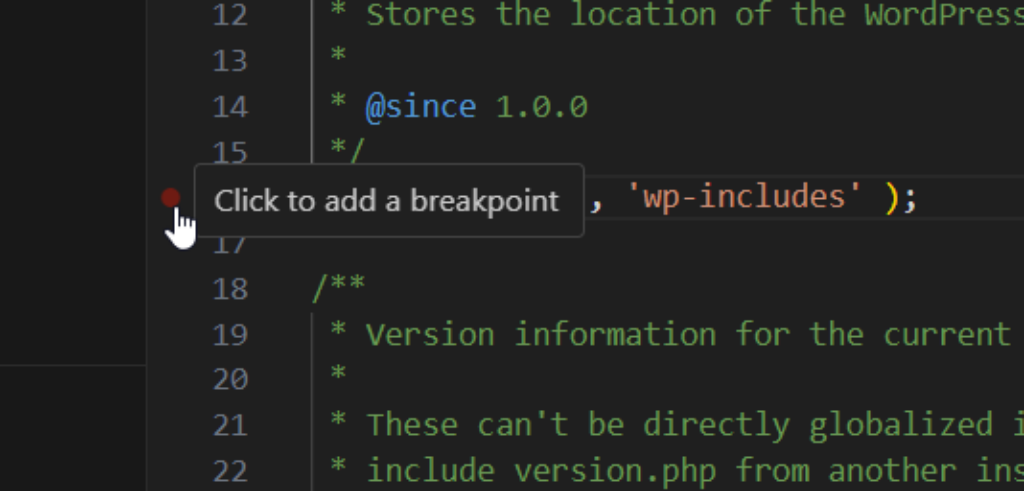
Click on a line to create a breakpoint so the red dot becomes solid red.
Now press F5 which is the same as clicking play on the debugger page and visit your website at https://localhost. You should see your website spinning.
Pop back to VS Code and you should see something like this:
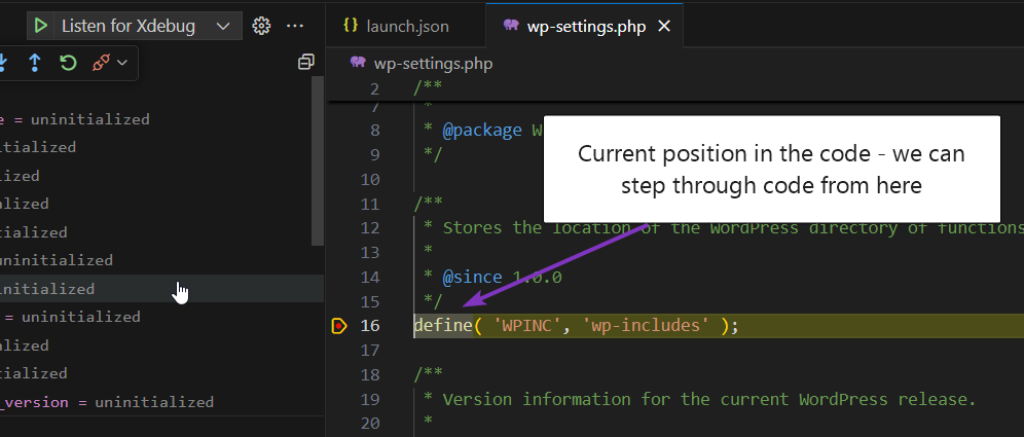
If you have this kind of thing, you have been successful! You now have Xdebug installed and working with VS Code.
The keyboard shortcodes for Xdebug in VS Code (and other IDEs) are:
- F5 – Start debugger
- SHIFT+F5 – Stop debugger
- F10 – continue to next line in this function
- F11 – continue to next line and go inside functions if required
- SHIFT + F11 – pop up out of this function. This is the same as the code running on its own until the current function call exits and then pausing at the line following the line that called the function
Useful knowledge for Xdebug and VS Code
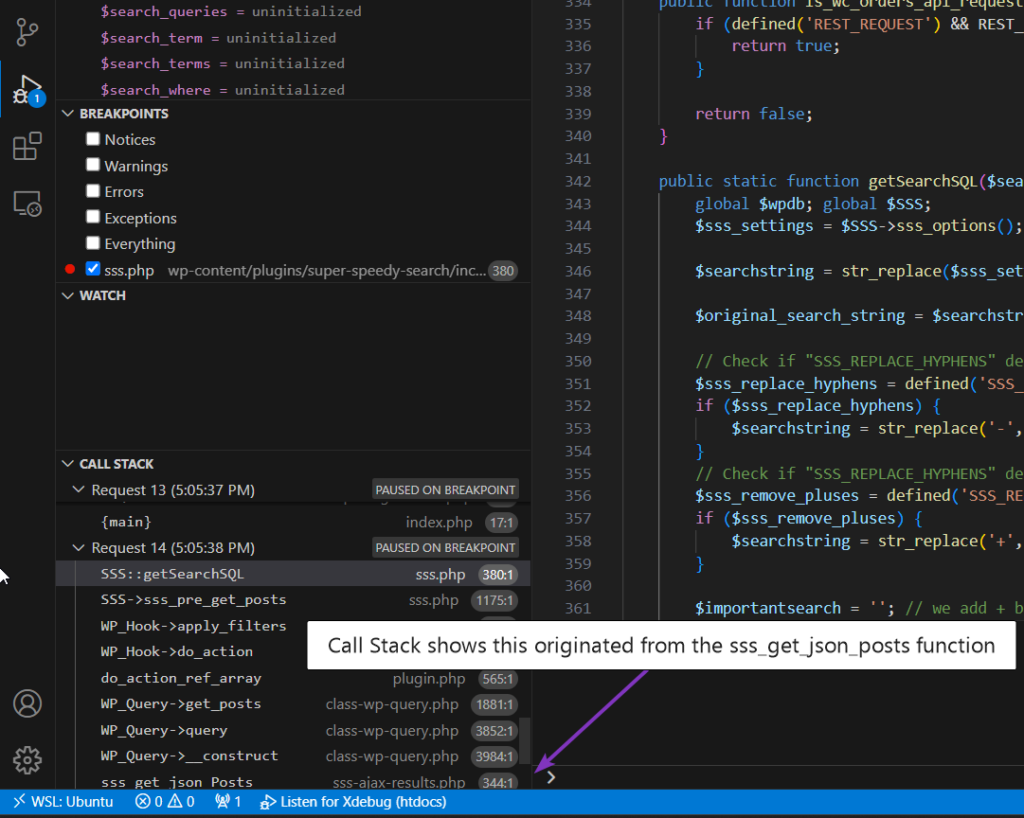
You can control generic breakpoints – e.g. in the debugger tab, you can choose to pause the debugger on all exceptions, i.e. including deprecated warnings, notices, etc
You can add watch variables which will show you values of variables based on the current window context.

You can see the Call Stack which is useful to see where this code was called from. You can click on any part of the call stack to jump up to the original function calls.
Summary
When armed with Xdebug, it becomes far easier to find the source of your plugin or theme issues. I highly recommend it! You can also do this with your remote servers, e.g. create a clone of your server (thank you Gridpane for making this so easy!) and connect VS Code to that remote server using SSH to then install Xdebug.